The product
What’s inside the workspace
Four groups of features, on your own GTFS and Census data. Start on Free, unlock the full suite with a 90-day trial.
Plan & cost
Sketch the change, watch the cost move
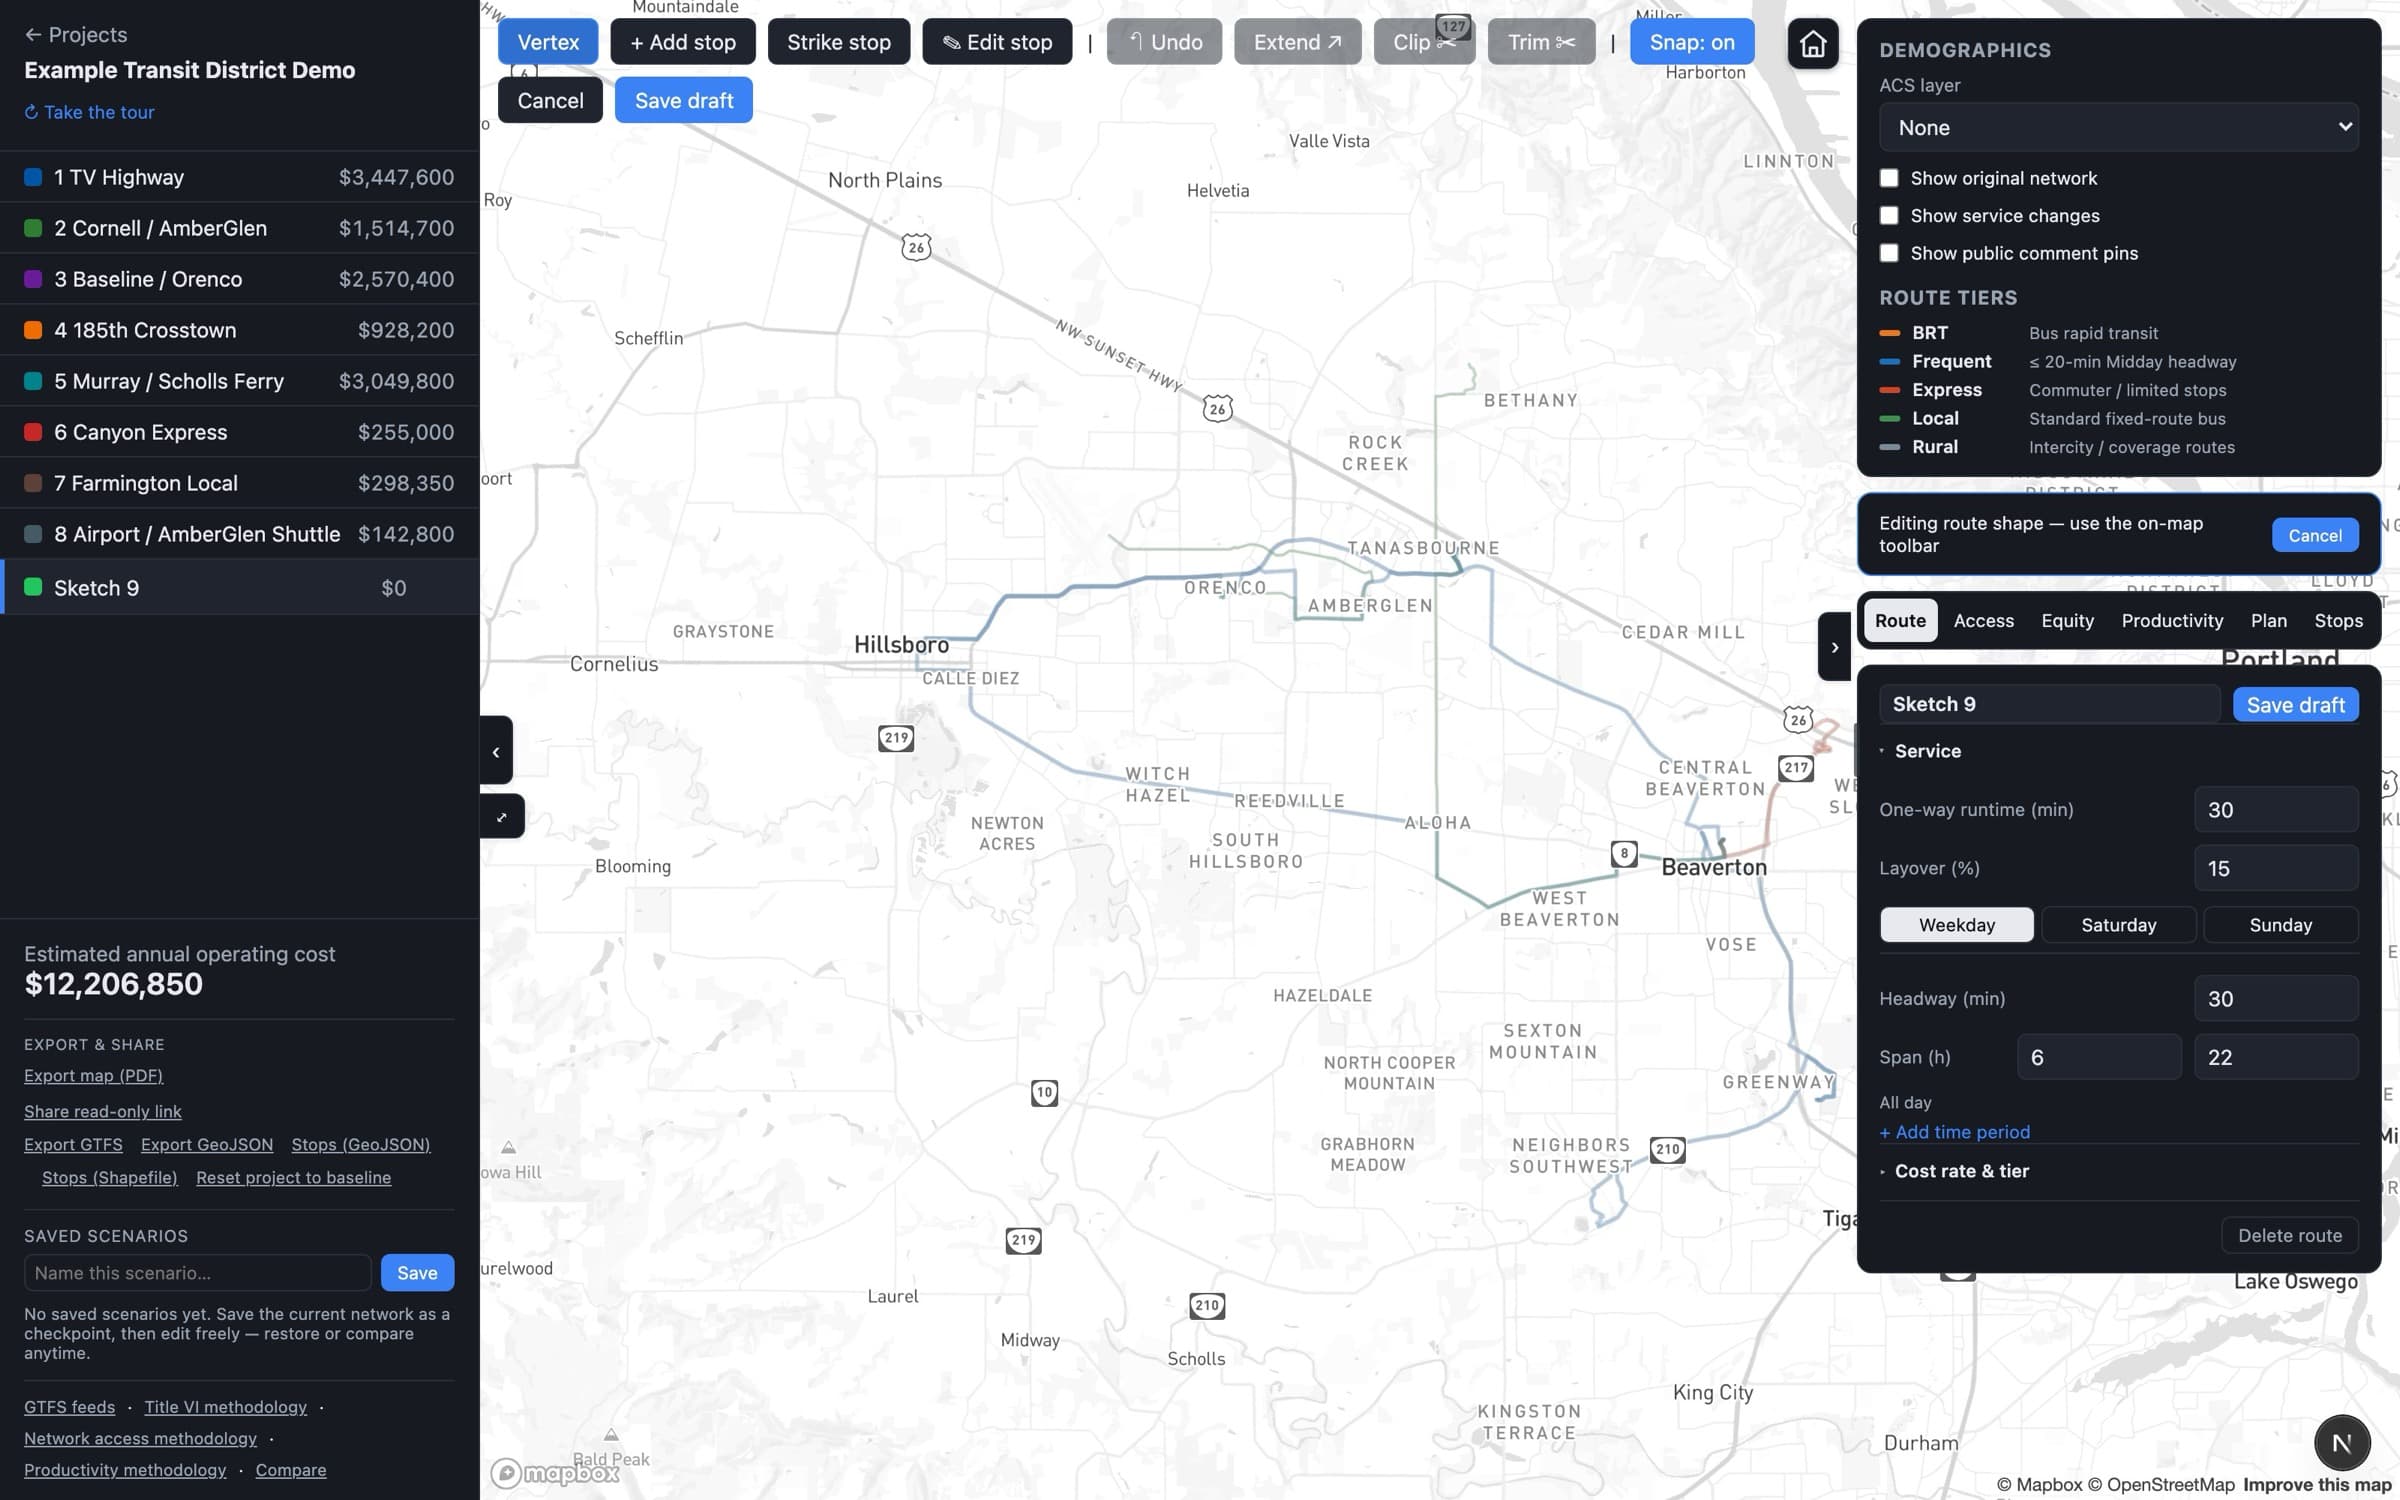
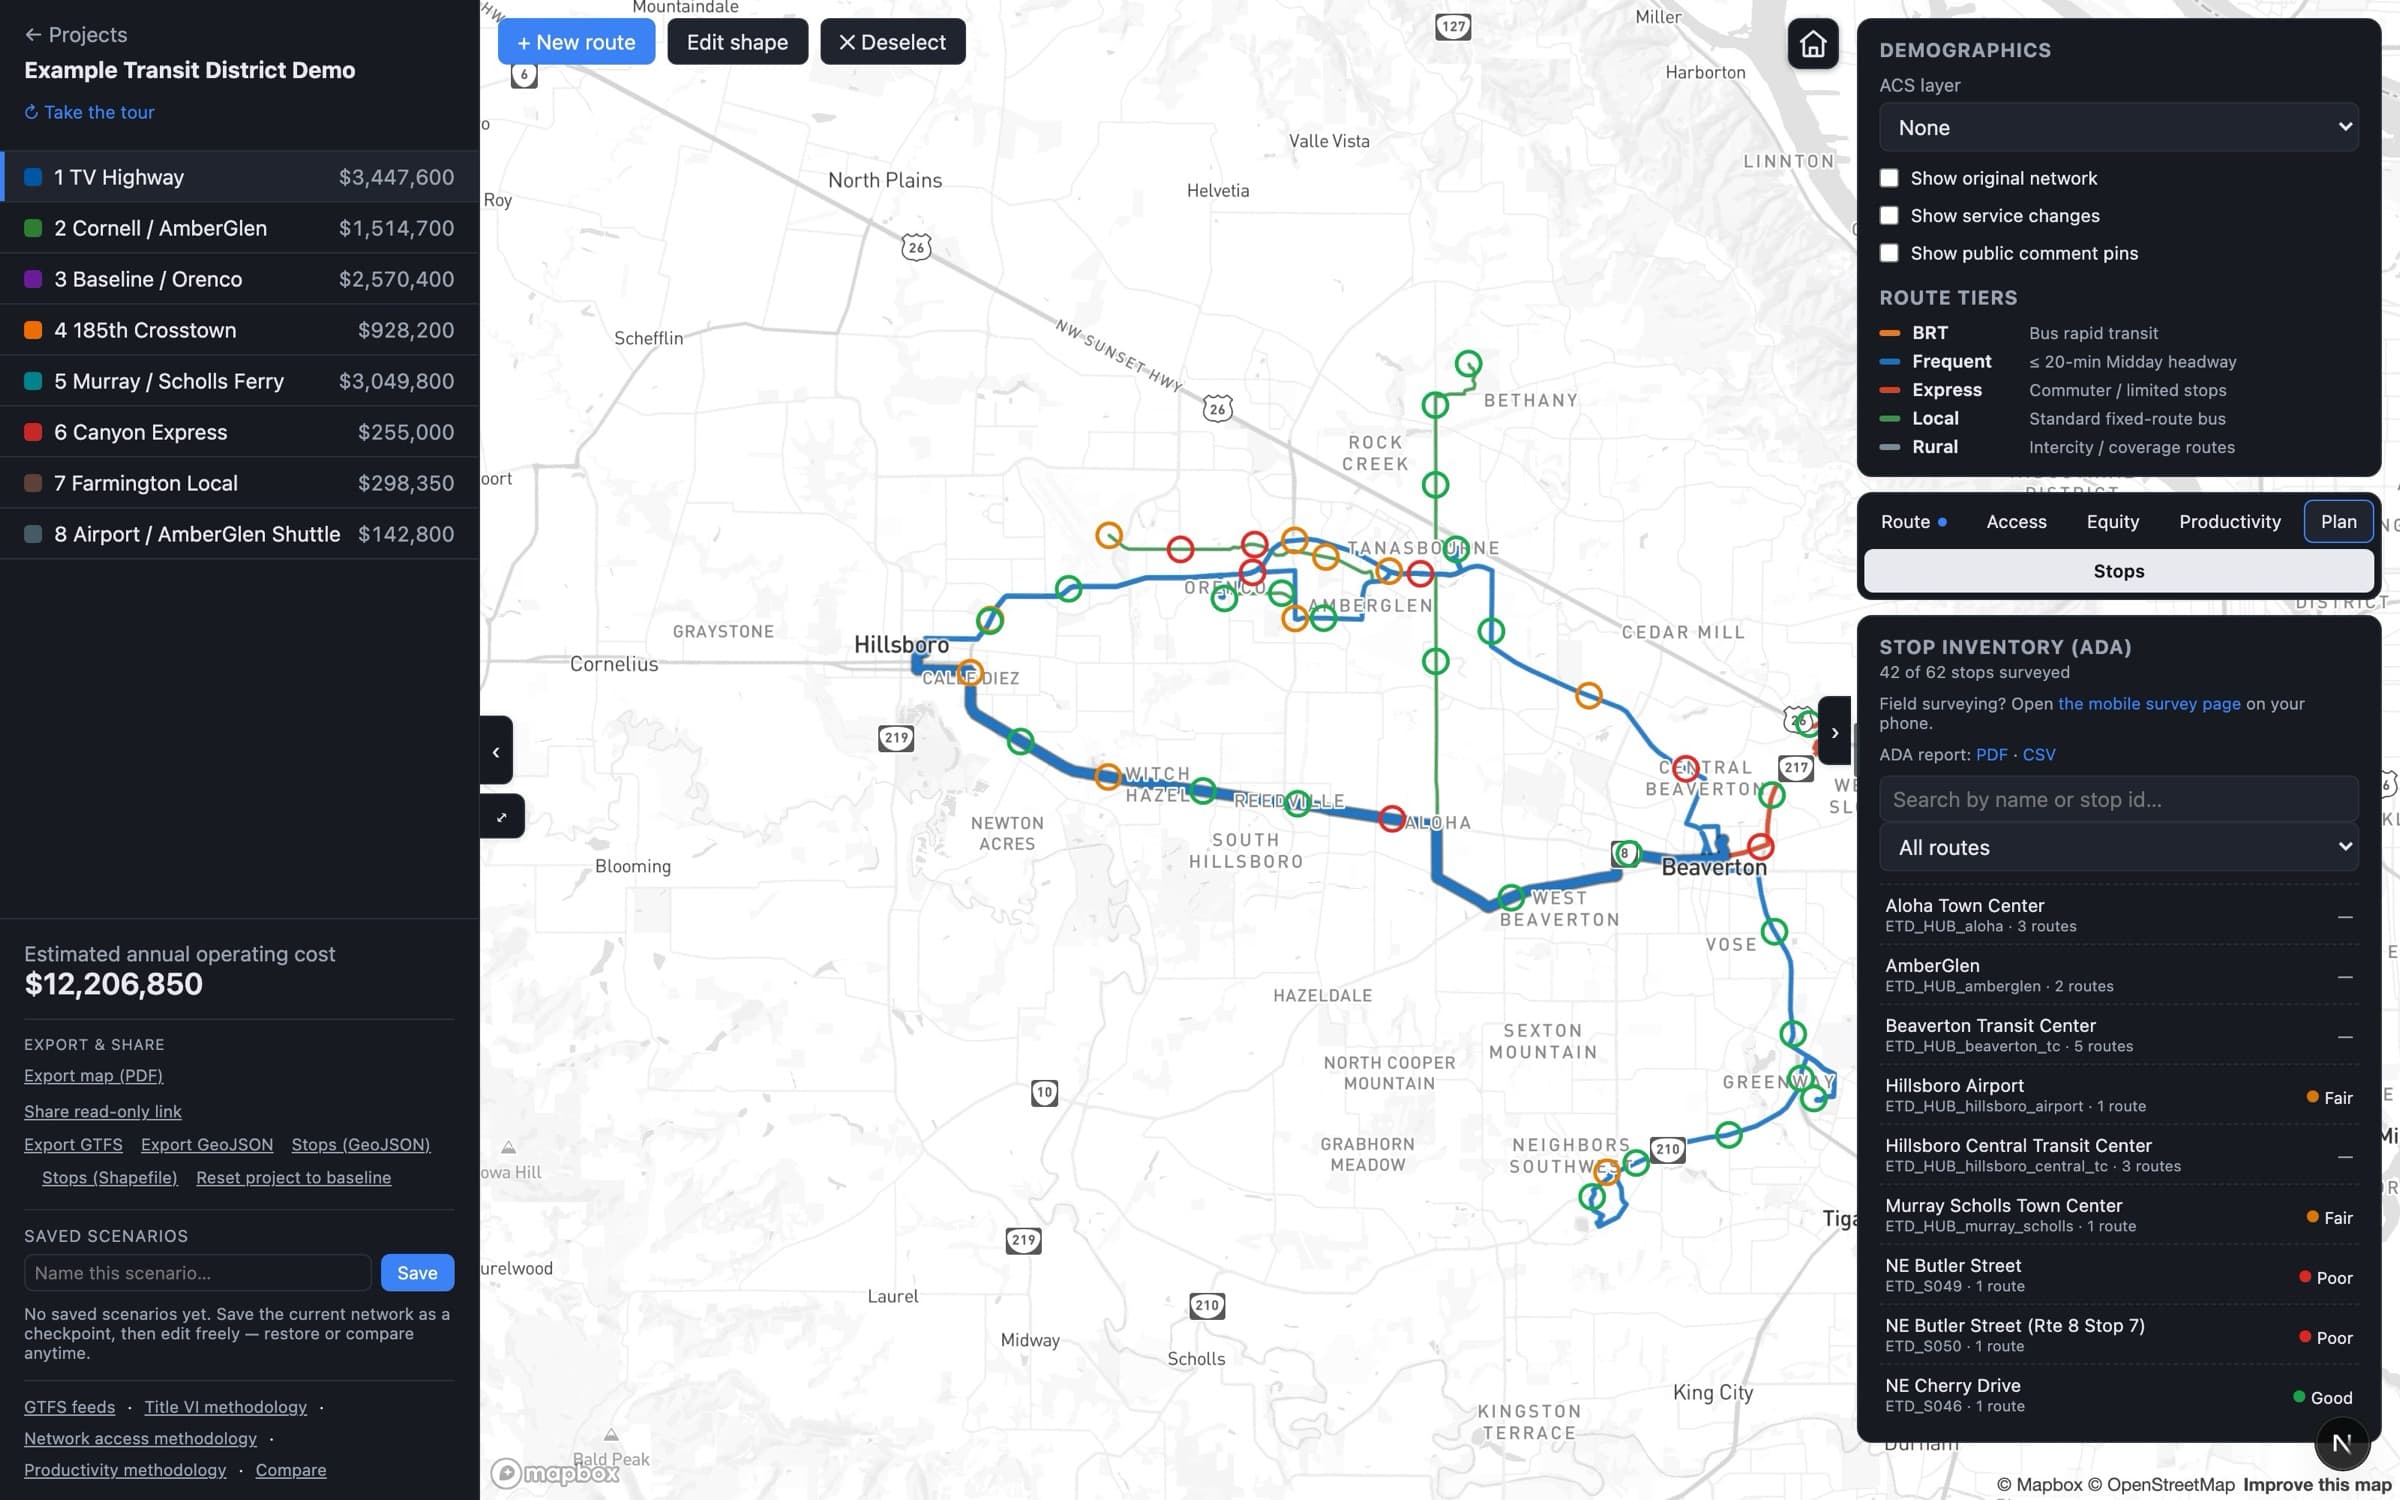
Draw a route, edit inbound and outbound separately, or reroute a section with the detour tool — cost and equity move as you go.
- Sketch service changes & save scenariosFree
- Edit routes by direction · inbound & outbound patterns independentlyPro
- Detour tool · reroute a section in a few clicks; save dated detoursPro
- Live operating cost as you draw · buses, revenue-hours, editable NTD national ratesFree
- Cost calibrated to your published actualsPro
- Route productivity & productivity × equityPro
- Scenario compare, before / afterPro
GTFS & sharing
Your feed, managed and published
All of it on the Free plan.
Upload, validate, export Free
Run your feed through the canonical GTFS validator, fix what it flags, export a clean feed any time.
Map PDFs & share links Free
Export a titled network or scenario map for a memo, and share any project read-only, no login required.
Edit stops Free
Rename, move, add and remove stops, record wheelchair boarding, and export a corrected feed.
Demographics, equity & access
See who’s affected, and show your work
- Census demographic map overlaysFree
- Service-area demographic stats & exportsPro
- Service-change equity analysis · FTA Circular 4702.1B four-fifths testPro
- Title VI report, PDF / editable WordPro
- Title VI Program · the every-3-year FTA documentPro
- Transit reach & job access from any point · 15 / 30 / 45 / 60 minPro
- Regional job-access heatmapPro
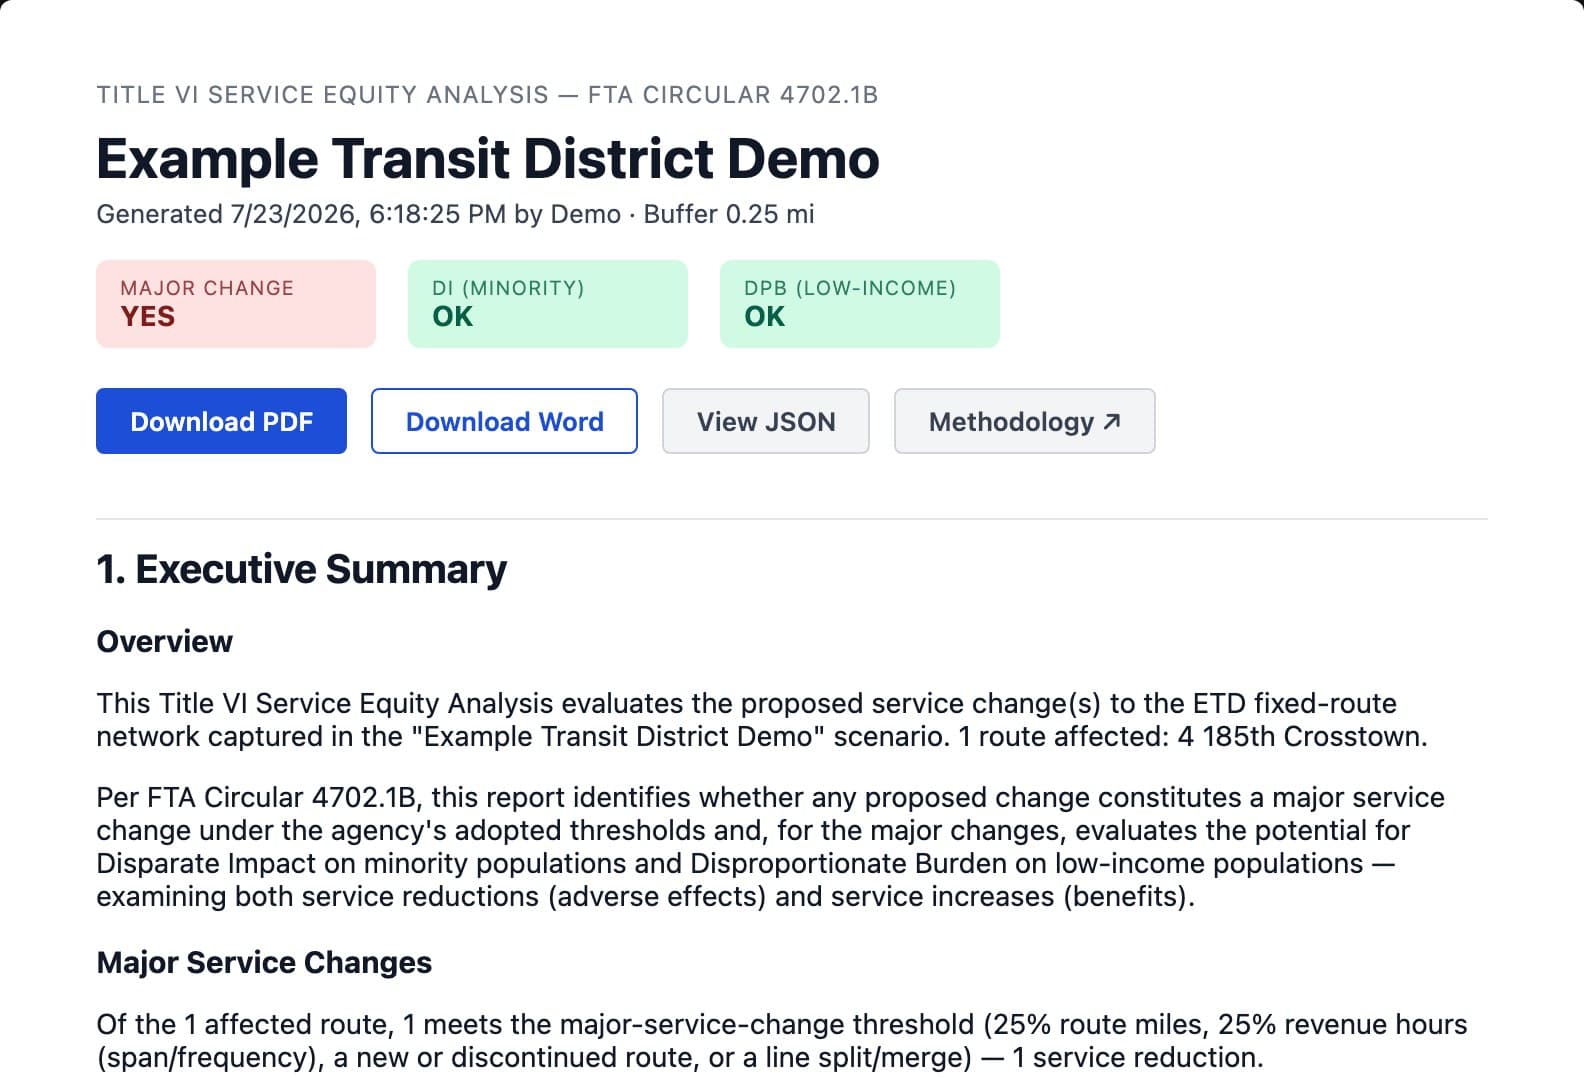
The Title VI report: major-change, disparate-impact & disproportionate-burden verdicts, ready to export.
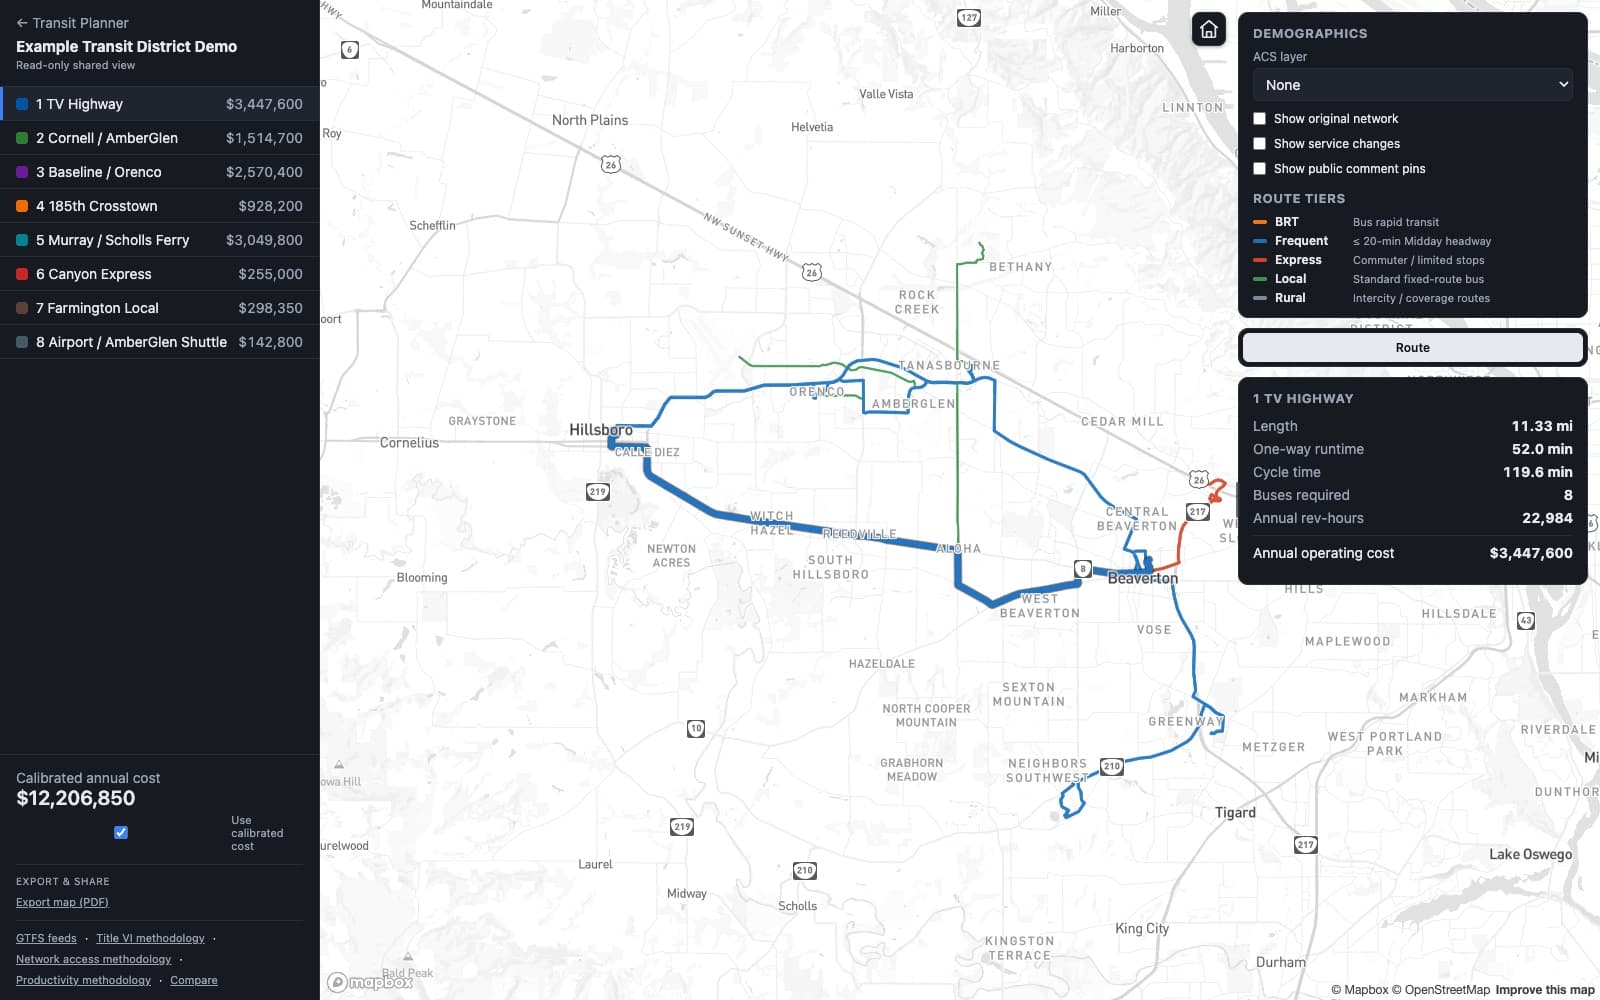
Every route costed against the agency’s own rate, with the network total updating as you edit.
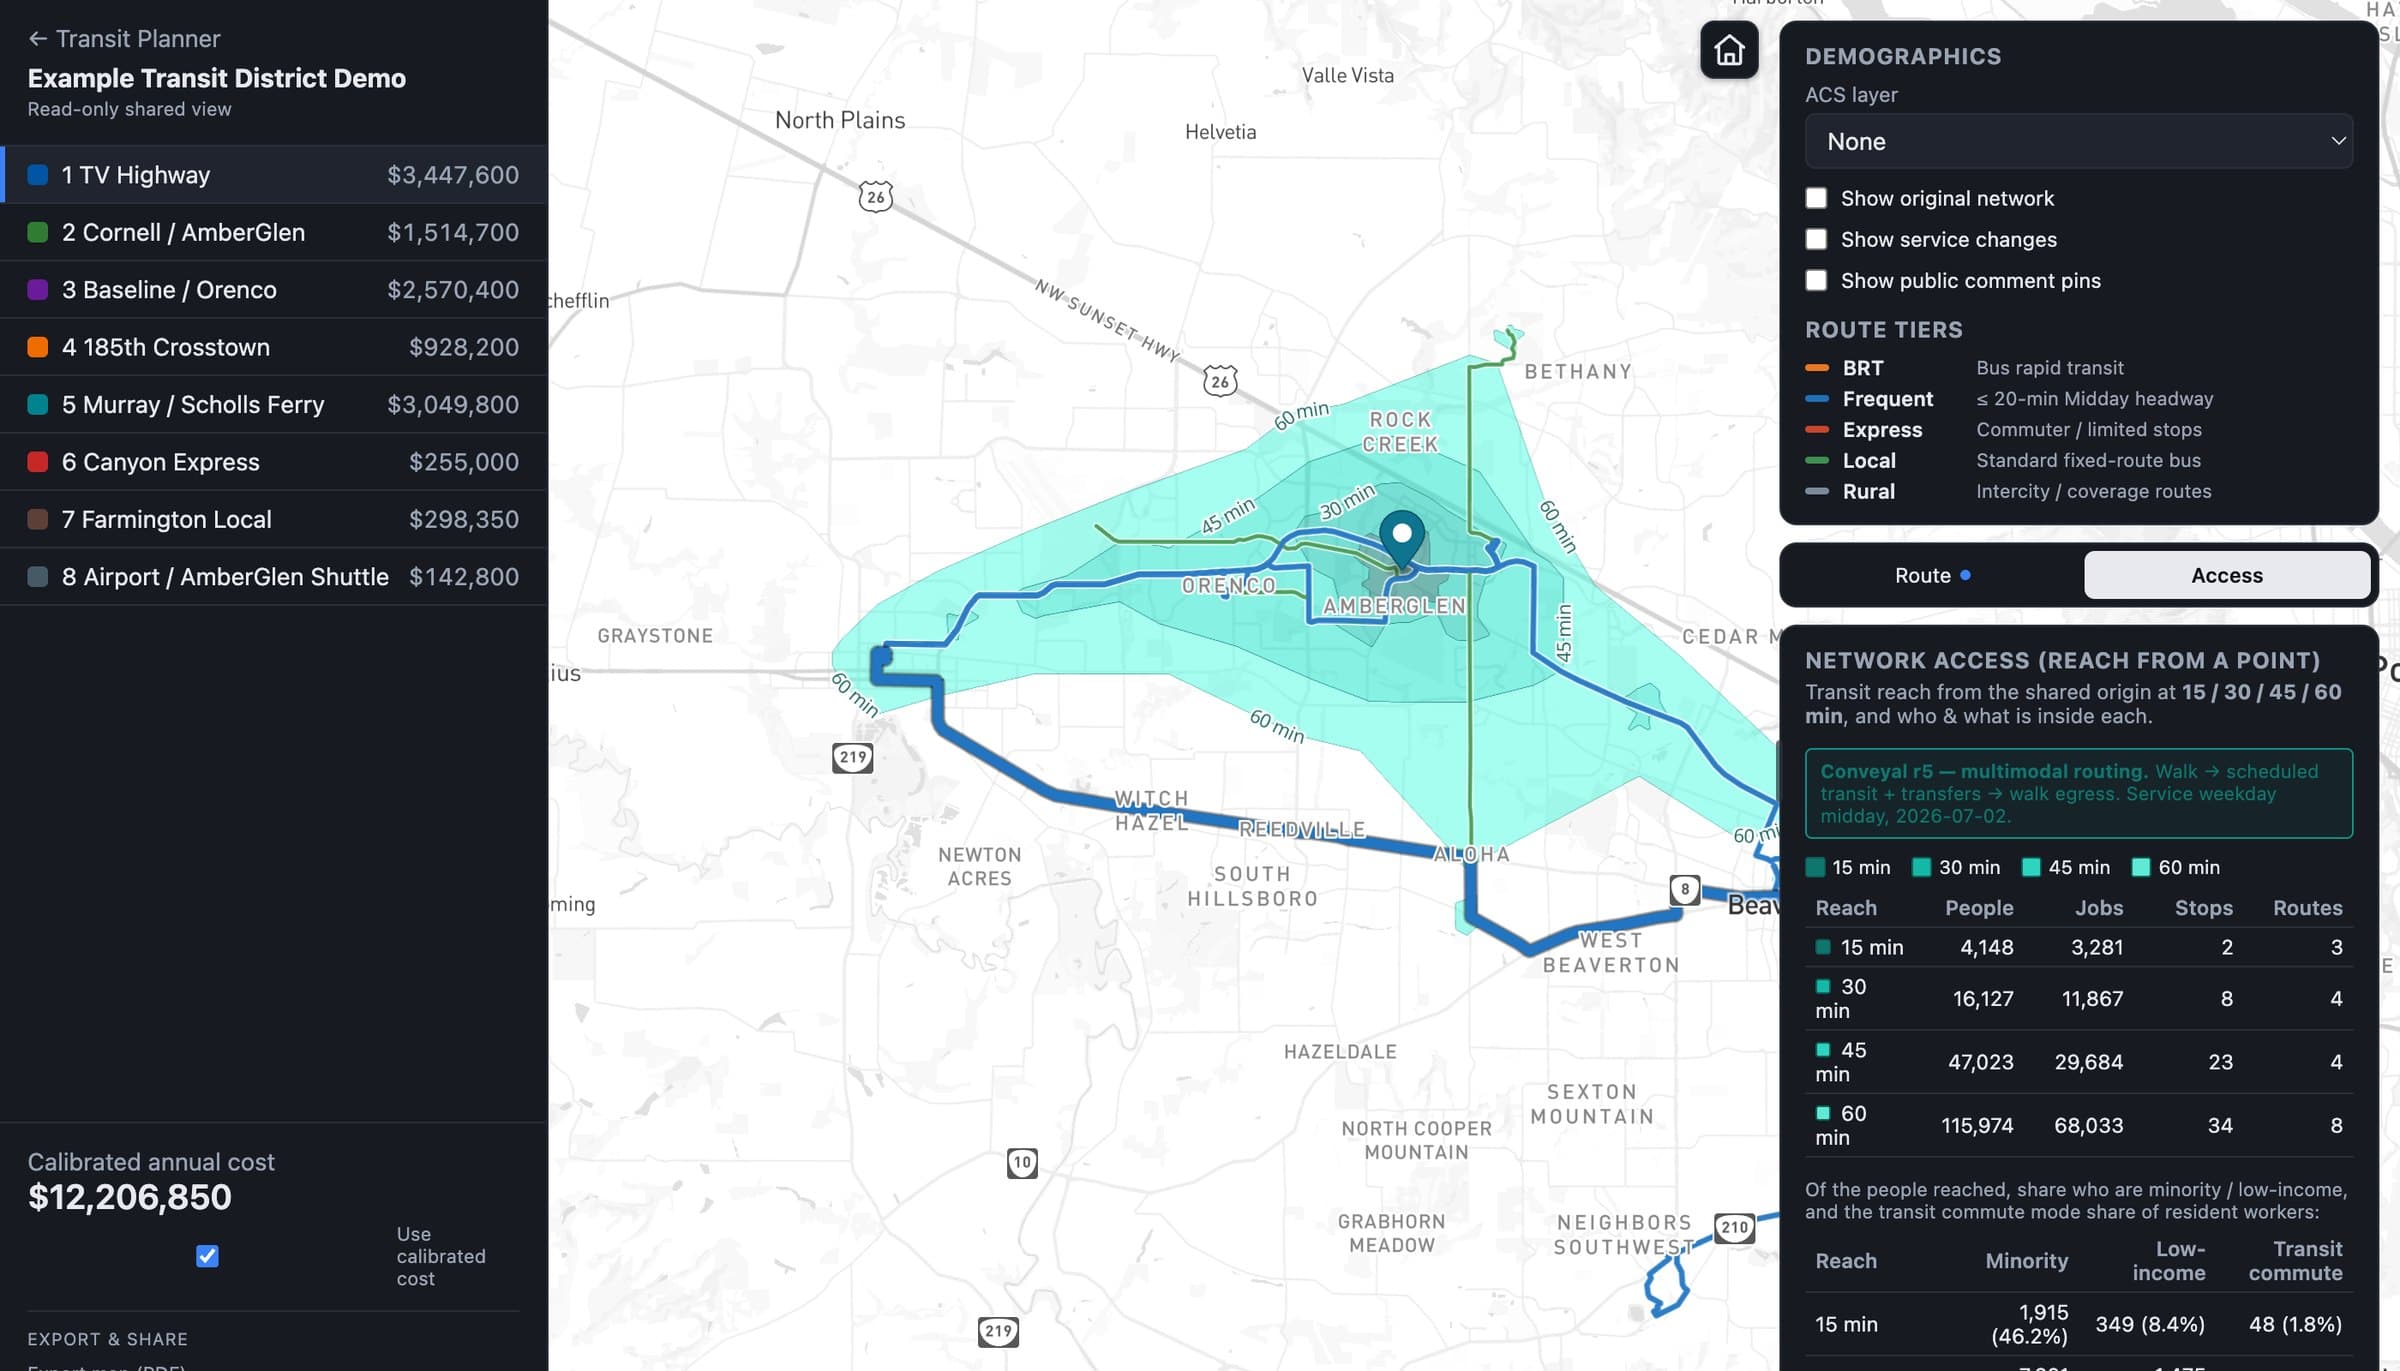
Click anywhere: true transit reach at 15 / 30 / 45 / 60 minutes — who and what is inside each band, routed on a real multimodal engine.
Stops, ADA & reports
From field survey to board packet
Mobile stop survey & inventory Free
Photos, amenities, and condition per stop, recorded from an iPhone in the field with the Transit Field app — GPS-sorted and offline-ready.
ADA stop-assessment report Pro
A detailed pedestrian-access assessment — landing area, sidewalk, visibility, hazards — turned into a prioritized report of stops flagged for review.
Hearing, NTD & board packets Pro
Service-change hearing packet, NTD report prep pack, board packet, and productivity report, from live data.
Public comment pages Pro
Publish a proposal for comment, moderate with an audit trail, and freeze the record into the hearing packet.
Everything exports Free + Pro
PDF, editable Word, JSON, and GTFS. GTFS and map PDFs are free; official board-ready, FTA-format, and public-engagement report exports need active Pro.
Feedback sets the roadmap Free + Pro
Built with agency planners in an active pilot. What they ask for next is what ships next.
Transit Field — the companion survey app Free
Your crew surveys bus stops from an iPhone, standing at the stop: photos, amenities, condition, and GPS. It works fully offline and syncs to the workspace when signal returns. Collection is free; the ADA assessment and equity analysis live in Pro.
Go deeper
Explore each capability
See it on your network in 15 minutes
We load your GTFS and walk through one real service change with you: the cost, who it affects, and the report. No sales script.