Free
forever tier for any transit agency
For small & mid-size transit agencies
Free for any transit agency: sketch and cost a service change as you draw, survey your stops from a phone, see your region’s Census demographics, and validate and export your GTFS, all on your own data in the browser. Pro adds impact and equity analysis, transit reach, route productivity and board-ready reports.
The free tier needs no credit card and no procurement: request a workspace with an agency email and we open it, normally within two business days. The live demo is a read-only sample network: a fictional agency on real streets, with real Census data.
The gap
Planning software is priced and staffed for the largest metros. Everyone else runs a transit system on spreadsheets and consultant studies.
Enterprise licenses, minimum contracts, and onboarding fees assume a big-metro budget. A 20-bus agency pays like a 500-bus one, so it usually buys nothing.
Who does this change affect, and by how much? Boards and public hearings ask before every major change, and most small agencies answer with a consultant study they can’t re-run.
GTFS, ridership counts, and Census ACS are sitting there today. The analysis they could power rarely gets run in-house, because nothing connects them.
Transit Planner is built for exactly this gap: free to start, flat-priced, and running on the data you already have.
How it works
Upload your agency’s feed, then re-route a line, cut or boost frequency, or add a crosstown. Save scenarios as you go.
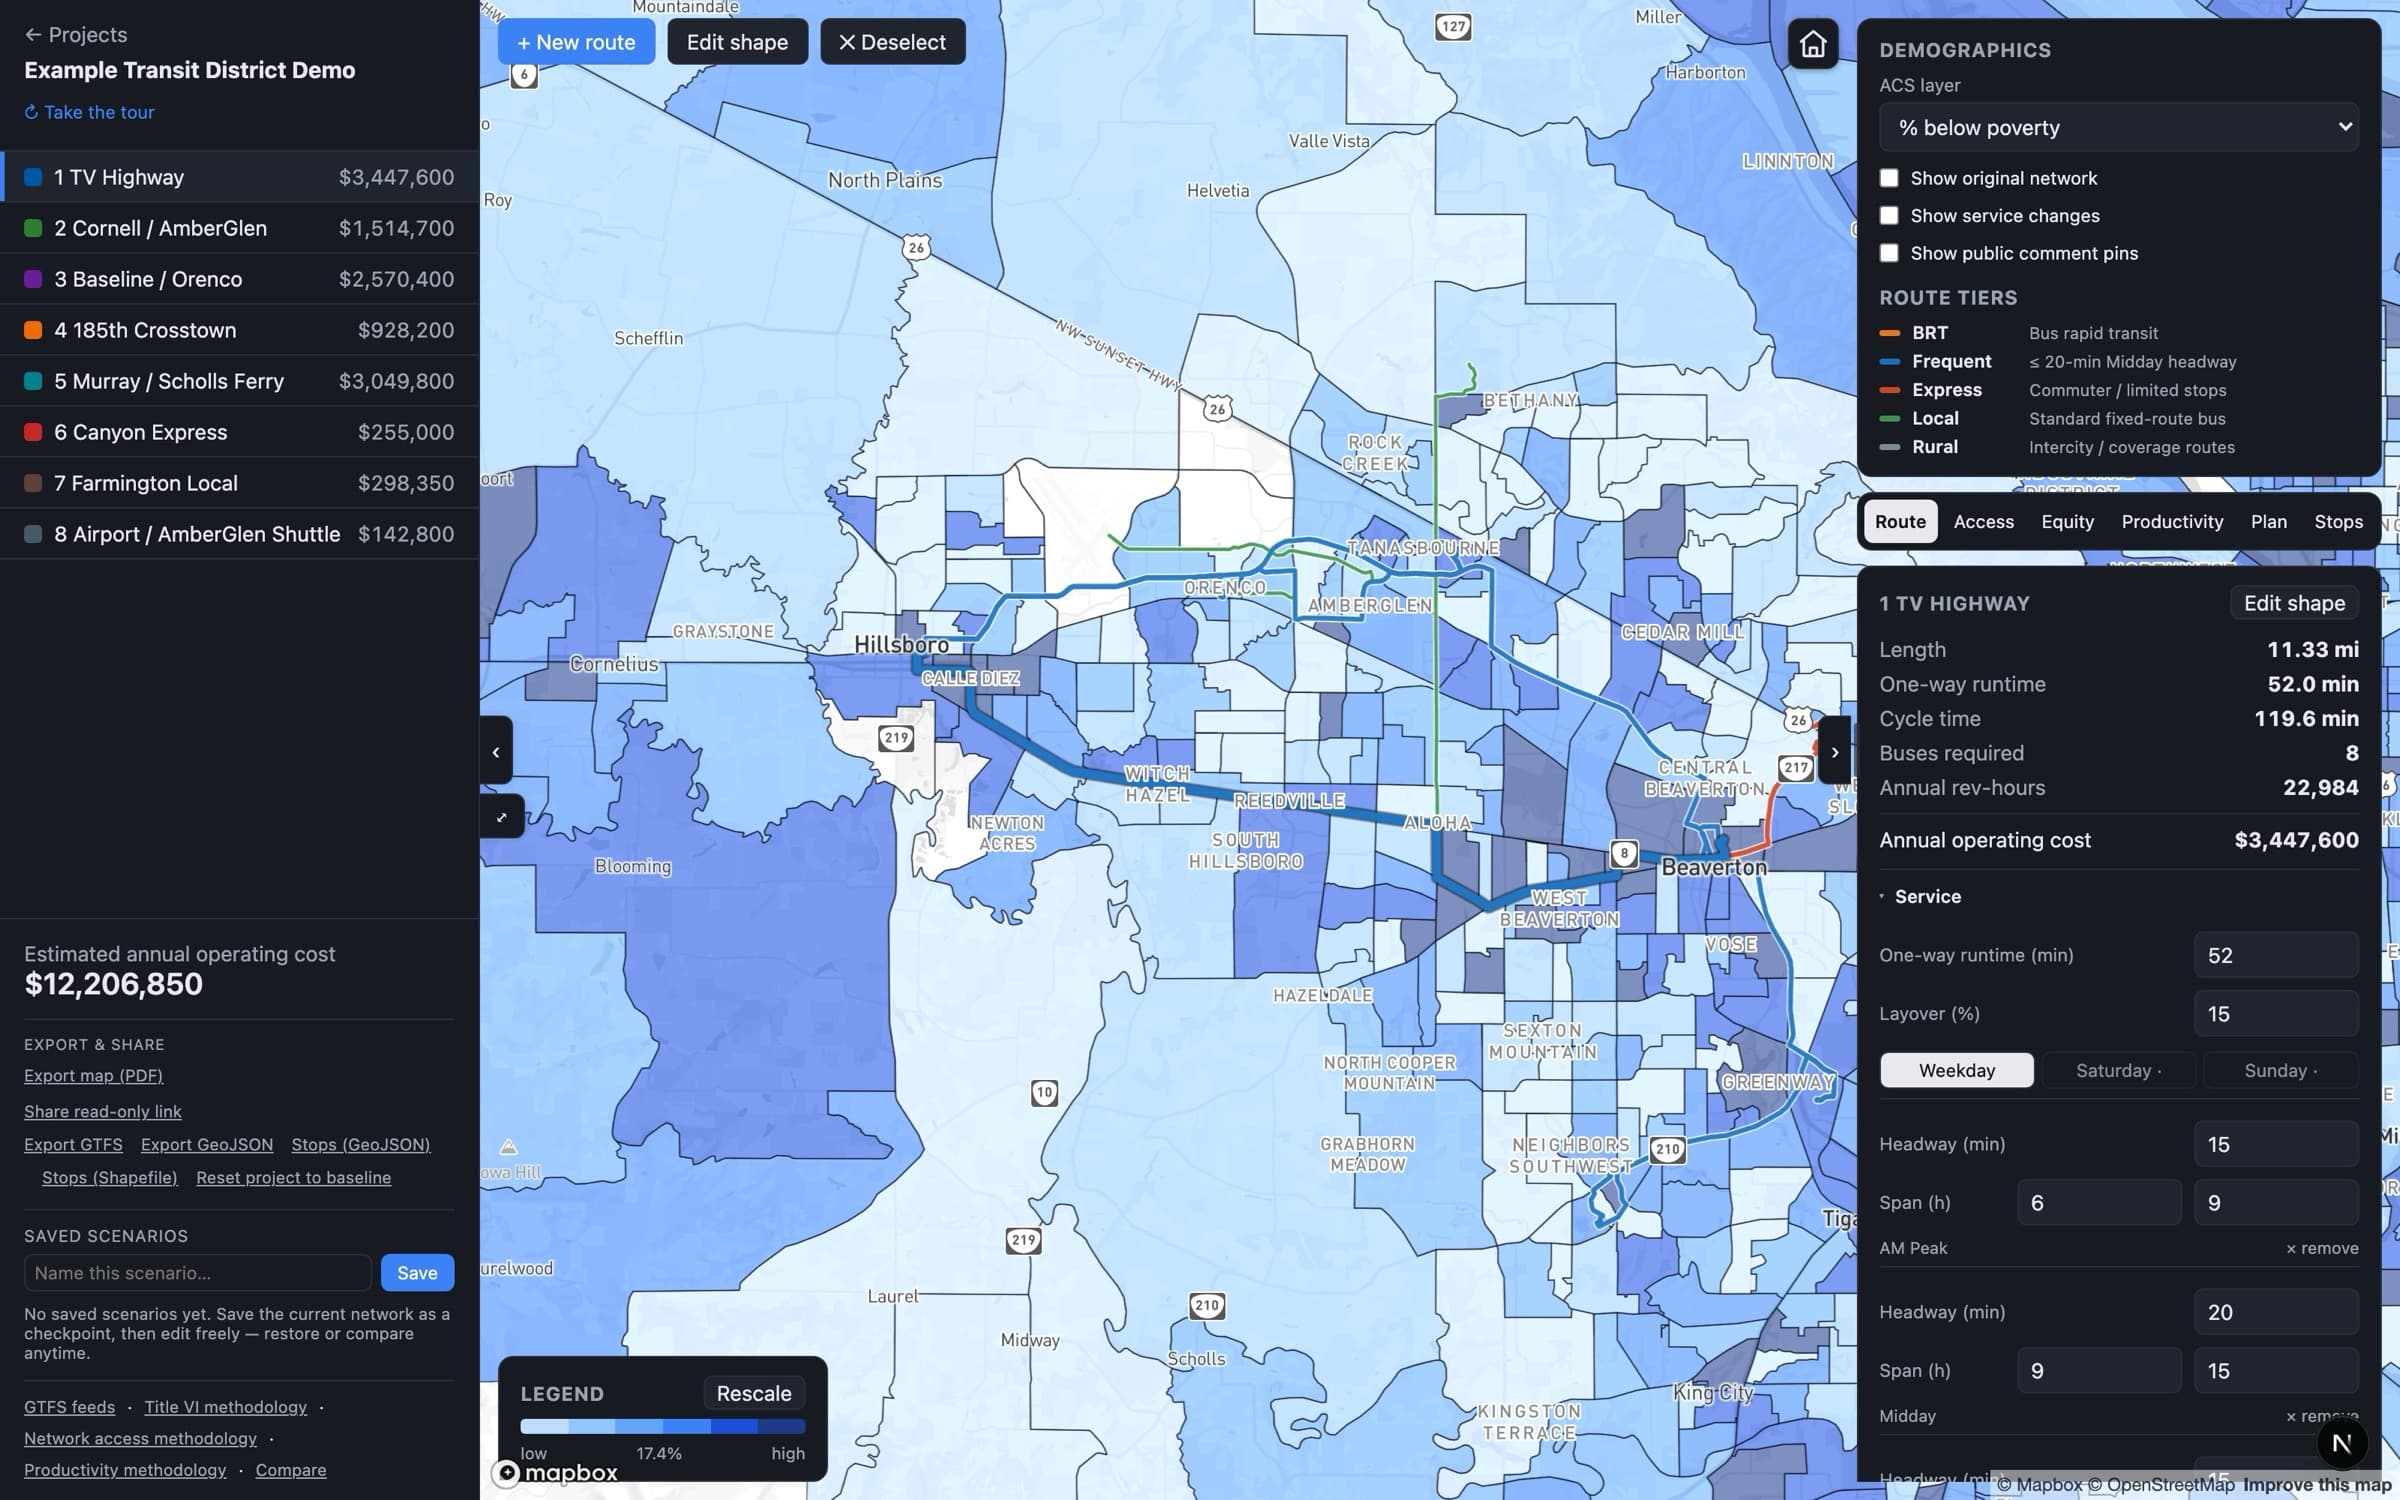
Buses required, revenue-hours, and annual operating cost update as you draw. Overlay your region’s demographics to see who’s affected.
One click runs the equity analysis, including the FTA Circular 4702.1B four-fifths test, and exports the report as PDF or editable Word.
What you get
Before-and-after impact by route or system-wide, with minority and low-income results and the four-fifths test built in. Done in-house in minutes and exported as PDF or editable Word.
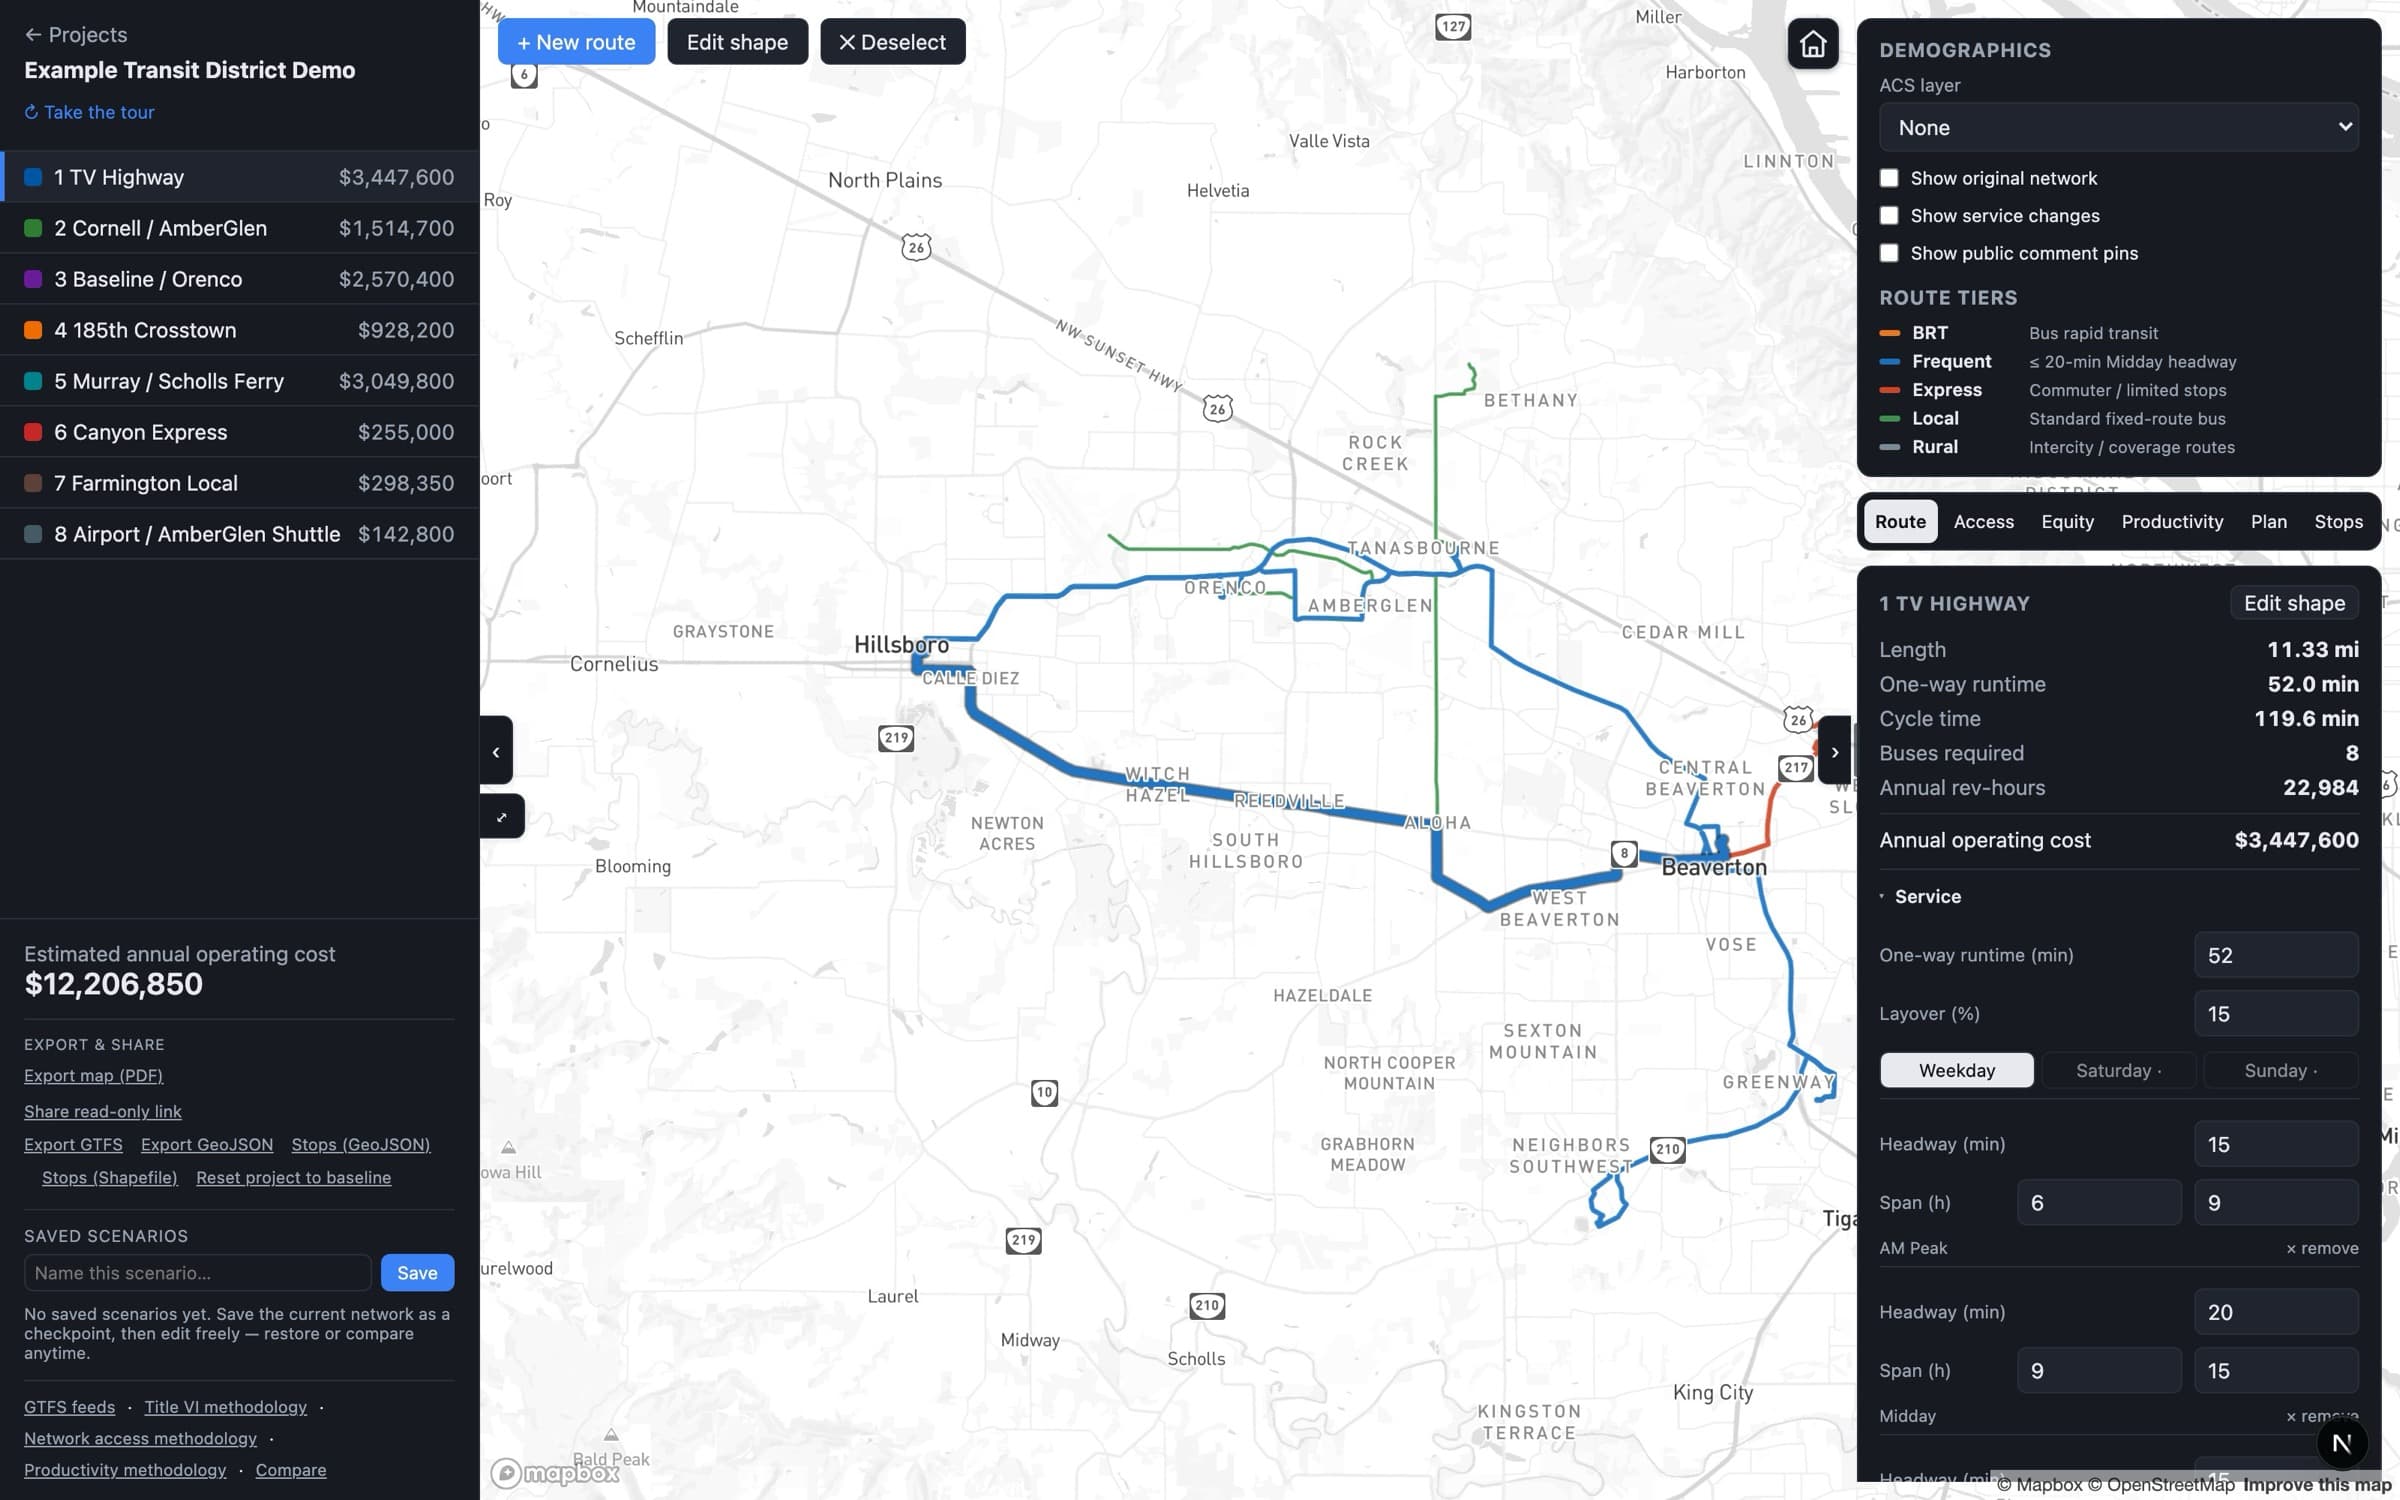
Draw or edit a line and watch buses required, annual revenue-hours, and operating cost update live. Pro adds per-direction editing, the detour tool, and cost calibrated to your published cost basis.
Census ACS for your region: poverty, minority, zero-vehicle, seniors, youth, disability, limited-English, on the map. Pro adds stats and exports for any area you draw.
Walk a corridor with the free Transit Field iPhone app and record shelter, bench, lighting, curb ramp, condition, and a photo per stop, GPS-sorted. Pro adds the ADA pedestrian-access assessment and report.
Click any point to see who, and how many jobs, are reachable at 15 / 30 / 45 / 60 minutes, with the minority and low-income share of that reach.
Service-change hearing packet, NTD report prep pack, board packet, productivity report. Assembled from your live data, exported as PDF or Word.
Proof
Tested on real agency networks in Oregon, Washington and Michigan.
A regional transit district Pacific Northwest
Transit Planner runs on a regional agency’s full published GTFS network, calibrated to its published operating cost, with equity analysis on real service-change scenarios — real agency data, not sample data.
TriMet Portland, OR · founder’s prior program
Before LMAi Labs, our founder built and ran TriMet’s tablet-based on-board rider survey program as agency staff.
Your live GTFS feed, your region’s ACS from the Census API, and your published cost basis, baked in.
The equity analysis follows FTA Circular 4702.1B (the four-fifths test and major-change triggers), with every step documented and auditable. Read the methodology
GTFS in, GTFS out. Reports export as PDF, Word, or JSON. Your data, your policy thresholds.
LMAi Labs is Baofeng Dong: 10+ years across TriMet, Amazon, and Confluent, a TCRP panel member, and the program manager behind TriMet’s electronic rider-survey program. Transit Planner is built working directly with agency planners, and their feedback sets the roadmap.
We load your GTFS and walk through one real service change with you: the cost, who it affects, and the report. No sales script.